The Problem With Traditional Stock Screens
You've probably used a stock screener before. Filter by P/E ratio, market cap, maybe revenue growth. You get a list of 50 stocks that all pass your criteria.
But here's the problem: those screens tell you nothing about momentum or relative strength.
A stock can have a great P/E ratio and still be a terrible investment if it's been underperforming for months. Conversely, some of the best trades come from stocks that look "expensive" by traditional metrics but are crushing their peers.
That's why we built AlphaRank—a system that answers a different question: Which stocks are actually winning?
What AlphaRank Measures
AlphaRank is a 0-100 composite score that measures how consistently a stock outperforms on two dimensions:
- Sector Strength (60% weight): Is this stock beating other stocks in its sector?
- Market Strength (40% weight): Is this stock beating the S&P 500?
A stock with a high AlphaRank isn't just going up—it's going up more than it should given its sector and market environment.
Why Two Benchmarks?
Comparing stocks to a single benchmark misses important context.
Example: Tech stocks rallied 40% last year. If NVIDIA went up 35%, is that good or bad?
- vs. Market (SPY): Great! NVIDIA beat the S&P 500 by 10+ points
- vs. Sector (XLK): Underperformance. NVIDIA lagged the tech sector
AlphaRank captures both dimensions. A stock that beats both its sector AND the market is doing something special.
The 60/40 weighting reflects our belief that sector outperformance (stock-picking skill) is slightly more important than absolute market returns. A stock beating its sector shows company-specific strength, not just riding a sector wave.
How the Rating System Works
Under the hood, AlphaRank uses an ELO rating system—the same math used to rank chess players.
Every week, each stock "plays two matches":
| Match | Opponent | What It Measures |
|---|---|---|
| Match 1 | Sector ETF | Stock-picking alpha |
| Match 2 | S&P 500 (SPY) | Market-beating ability |
Win: Stock outperforms the benchmark that week Loss: Stock underperforms the benchmark Tie: Performance within a tight band
After each match, the stock's ELO rating adjusts up or down. Over 26 weeks, this creates a robust measure of consistent outperformance—not just a lucky week or two.
The Math (Simplified)
code-highlightWeekly excess return = Stock return - Benchmark return

Volatility-adjusted score = Excess return / (Stock volatility × √5)

ELO change based on:
- Did the stock win, lose, or tie?
- What was "expected" given current rating?
- Capped at ±40 points per week (prevents flukes from dominating)
The result: Stocks that consistently beat their benchmarks rise to the top. Stocks that occasionally spike but usually lag settle in the middle.
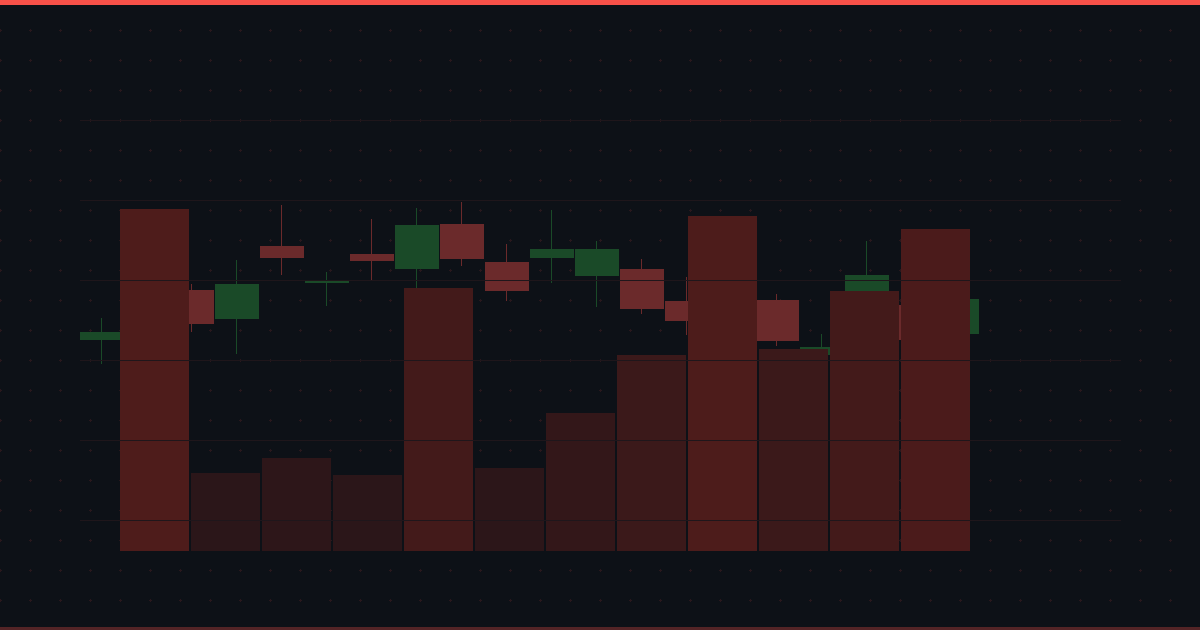
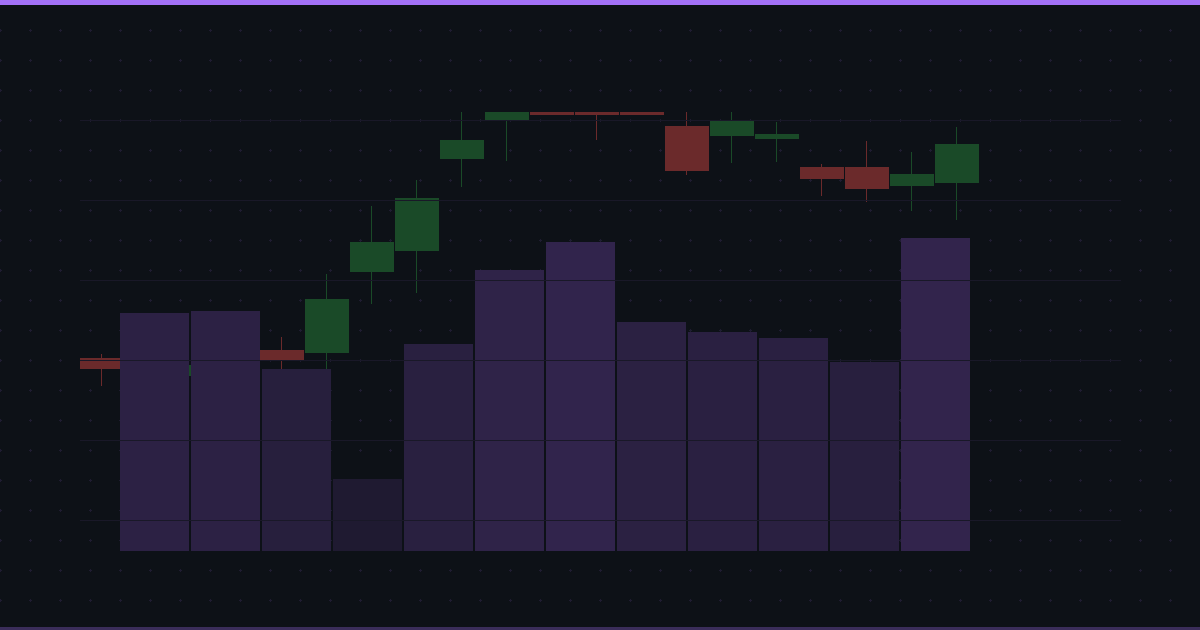
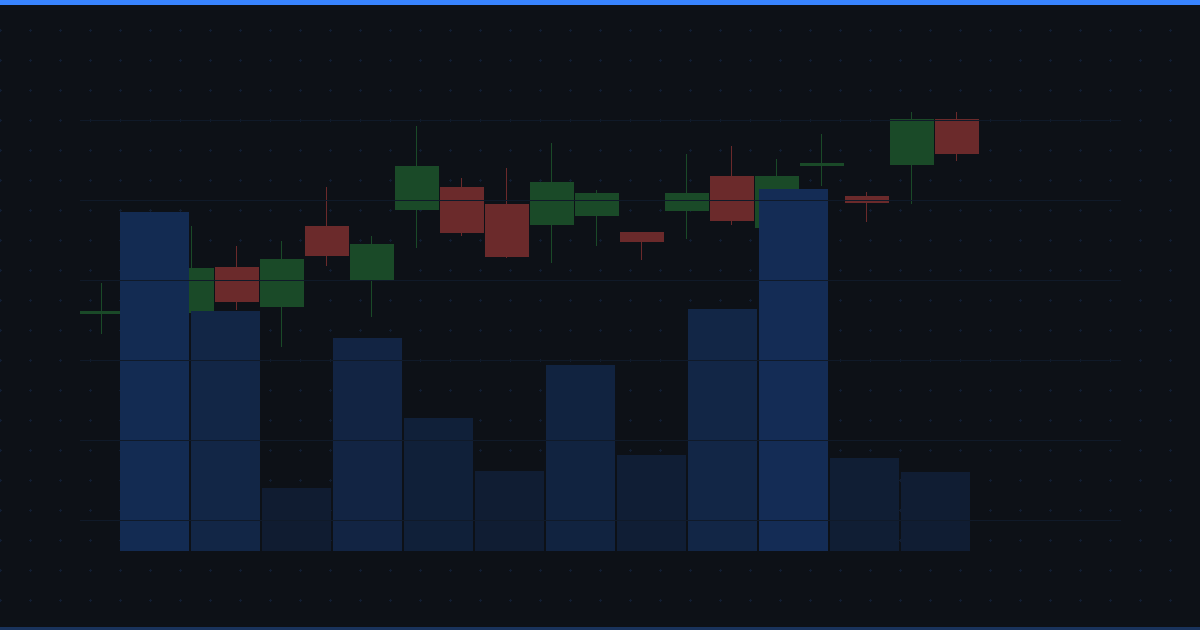
Reading the Power Rankings
Head to Power Rankings to see AlphaRank in action. Here's how to interpret what you see:
The AlphaRank Score (0-100)
| Score Range | Interpretation |
|---|---|
| 90-100 | Elite. Consistently crushing both benchmarks |
| 75-89 | Strong. Solid outperformance on both dimensions |
| 50-74 | Mixed. Beating one benchmark, lagging the other |
| 25-49 | Weak. Underperforming relative to alternatives |
| 0-24 | Avoid. Consistent underperformer |
The Win-Loss Record
Each stock shows its 26-week record vs. both benchmarks:
code-highlightNVDA: 18-6-2 (Sector) | 20-5-1 (Market)
This means:
- vs. Sector: 18 wins, 6 losses, 2 ties
- vs. Market: 20 wins, 5 losses, 1 tie
A stock with 18+ wins out of 26 weeks is showing remarkable consistency.
Three Viewing Modes
The Power Rankings table offers three perspectives:
1. Combined (Default) Uses the full AlphaRank formula (60% sector + 40% market). Best for finding balanced outperformers.
2. Sector Only Ranks purely by sector outperformance. Use this to find the best stock within a sector you want exposure to.
3. Market Only Ranks purely by S&P 500 outperformance. Use this when you care about absolute returns regardless of sector.
Pro tip: Toggle between modes to find stocks that rank highly in multiple views. A stock that's top 20 in Combined AND top 20 in Sector Only is exceptionally strong.
How to Use AlphaRank in Your Investing
Strategy 1: Buy the Leaders
The simplest approach—focus on stocks with AlphaRank above 80.
These stocks are demonstrating persistent outperformance. While past performance doesn't guarantee future results, momentum tends to persist. Academic research consistently shows that recent winners continue winning more often than chance would predict.
How to implement:
- Go to Power Rankings
- Sort by AlphaRank (highest first)
- Review the top 20-30 stocks
- Apply your own fundamental filters (valuation, quality, etc.)
- Build a watchlist of leaders that also pass your criteria
Strategy 2: Sector Rotation
Use the Sector Only view to find the best stocks within sectors you want to own.
Example: You're bullish on energy. Instead of buying XLE (the sector ETF), find the energy stocks with the highest sector rankings. You get energy exposure through the names most likely to outperform.
How to implement:
- Select "Sector Only" view
- Filter to your target sector
- Buy the top 3-5 ranked stocks in that sector
- Rebalance monthly as rankings shift
Strategy 3: Avoid the Laggards
AlphaRank is equally useful for identifying what not to own.
Stocks with AlphaRank below 30 are consistently underperforming both their sector and the market. Unless you have a strong contrarian thesis, these are candidates for selling or avoiding.
Warning signs:
- AlphaRank below 30
- Losing record in both sector AND market matches
- Declining from a previously high ranking
Strategy 4: Momentum + Value Combo
Combine AlphaRank with traditional value screens for a "quality momentum" approach.
Criteria:
- AlphaRank > 70 (momentum filter)
- P/E < 25 (value filter)
- Revenue growth > 10% (quality filter)
This finds stocks that are both fundamentally attractive AND showing relative strength. You're not buying cheap stocks that are cheap for good reason—you're buying reasonably priced stocks the market is starting to recognize.
Real Examples from the Rankings
Let's look at what the data typically reveals:
The Consistent Winner
A stock like NVDA might show:
- AlphaRank: 94
- Sector record: 20-4-2
- Market record: 22-3-1
- Interpretation: Dominant. Beating both benchmarks ~80% of weeks
This is a stock in a clear uptrend with institutional support. The consistent wins suggest this isn't just volatility—it's persistent demand.
The Sector Star, Market Laggard
A utility stock might show:
- AlphaRank: 58
- Sector record: 19-5-2 (strong!)
- Market record: 8-16-2 (weak)
- Interpretation: Best utility stock, but utilities are lagging
This stock is worth owning if you want utility exposure. It's the best house in a weak neighborhood.
The Falling Knife
A former leader might show:
- AlphaRank: 35 (down from 85 three months ago)
- Sector record: 8-16-2
- Market record: 6-18-2
- Interpretation: Momentum has broken down
This is a warning sign. Whatever drove the stock's outperformance has faded. Catching falling knives is dangerous—the ranking system is telling you something has changed.
Why ELO Instead of Simple Returns?
We could have just ranked stocks by 6-month return. Here's why we didn't:
Problem 1: Volatility Distortion
A stock that went up 50% with massive swings isn't the same as a stock that went up 50% in a steady climb. Simple returns treat them equally. ELO's volatility adjustment penalizes erratic performers.
Problem 2: Recency Bias
A stock that jumped 30% last week and did nothing for 25 weeks would rank highly by simple returns. ELO weights all weeks equally, favoring consistent performers over one-hit wonders.
Problem 3: No Benchmark Context
Raw returns ignore market conditions. A 20% gain during a 25% market rally is actually underperformance. ELO captures relative performance against relevant benchmarks.
Problem 4: Outlier Sensitivity
One huge week could dominate a simple return calculation. ELO caps the rating change per week (±40 points), preventing single events from distorting the picture.
The ELO approach mirrors how you'd evaluate a fund manager. You wouldn't judge a manager by one great quarter—you'd look at their consistency over years. AlphaRank applies that same lens to individual stocks.
Backtested Performance
We've validated the AlphaRank system against historical data. The results are encouraging:
52-Week Backtest Results:
- Top-ranked decile outperformed SPY by +15.7% annually
- Bottom-ranked decile underperformed SPY by -12.3% annually
- Spread between top and bottom: 28%
This isn't a guarantee of future results, but it demonstrates that the ranking methodology captures something real about stock behavior.
Why it works:
- Momentum is a documented market anomaly
- Relative strength persists over intermediate timeframes
- Institutional investors tend to add to winners, creating self-reinforcing flows
Getting Started
Ready to find your next great stock? Here's a quick-start guide:
Step 1: Visit Power Rankings
Step 2: Review the top 20 stocks by AlphaRank
Step 3: Note which sectors are dominating (tells you where momentum is)
Step 4: Click into individual stocks to see their full profile
Step 5: Set alerts on your favorites to track when they break key levels
Track the Leaders in Real-Time
Set alerts on high-AlphaRank stocks. Get notified when they break out, pull back, or hit your target price.
S&P 500 Screener
Filter by metrics, fundamentals
Price Alerts
Never miss a move
35+ Global Markets
Stocks, crypto, futures
AI Analysis
Powered by Claude
Key Takeaways
-
AlphaRank measures relative strength — Not just returns, but returns vs. appropriate benchmarks
-
Dual benchmarks matter — Beating your sector AND the market is harder (and more meaningful) than beating just one
-
Consistency beats magnitude — A stock that wins 18/26 weeks is more reliable than one that had two huge weeks
-
Use rankings as a starting point — AlphaRank tells you what's working; you still need to decide if it fits your portfolio
-
Watch for regime changes — A falling AlphaRank is an early warning that momentum may be breaking down
The market rewards stocks that outperform. AlphaRank helps you find them systematically, before they become obvious to everyone else.