Dead Cat Bounce Explained: How to Tell a Fake Recovery From a Real One
A dead cat bounce is a sharp, temporary rally in a stock that's still headed lower. Four real 2022-2023 bankruptcies show exactly what one looks like on a chart, why it happens, and how to set alerts instead of getting trapped chasing it.
Right before four different companies went bankrupt in 2022 and 2023, their stocks did the same thing: they bounced hard, looked like they'd found a floor, and then kept falling toward zero. Here's what a dead cat bounce actually looks like using real price data, why it happens, and how to avoid mistaking one for a genuine recovery.
The name comes from a grim trading-floor joke: even a dead cat will bounce if it falls from high enough. Applied to a stock, it means a sharp, short-lived rally inside a longer downtrend — one that looks like the worst is over, and isn't.
Dead cat bounces are common in exactly the situations where investors are most tempted to buy the dip: stocks that have already fallen 50%, 80%, or 95% and now look "cheap." The four real examples below aren't cherry-picked outliers — they're what happened to First Republic Bank, Rite Aid, WeWork, and Party City in the weeks before each one filed for bankruptcy or was seized by regulators.
What a Dead Cat Bounce Actually Looks Like
| Company | Bounce window | Low | High | Bounce | What happened next |
|---|---|---|---|---|---|
| First Republic Bank (FRC) | Mar 20 - Apr 24, 2023 | $12.18 | $16.00 | +31.4% | Q1 earnings revealed $100B+ in deposit outflows; stock fell 97.8% to $0.35 within 9 trading days, then FDIC seized the bank |
| Rite Aid (RAD) | Aug 1 - Aug 8, 2023 | $1.70 | $2.83 | +66.5% | Stock fell 95.6% to $0.13 by mid-October as bankruptcy reporting intensified; Chapter 11 filed Oct 15, 2023 |
| WeWork (WE) | Sep 8 - Sep 13, 2023 | $2.65 | $5.74 | +116.6% | Stock fell 85.4% to $0.84 by early November; Chapter 11 filed Nov 6, 2023 |
| Party City (PRTY) | Jan 9 - Jan 10, 2023 | $0.21 | $0.45 | +117.9% | Round-tripped -37% the very next session; Chapter 11 filed Jan 17, 2023 |
Every one of these stocks put in a real, double-digit-or-bigger percentage bounce — First Republic's took five weeks to build, Party City's happened in a single trading day — and every one of them fully failed. None of the underlying problems (a bank run, a store-closure wave, a debt load nobody would refinance) were actually resolved. The price action just made it look that way for a few days or weeks.
First Republic is the most instructive case because the bounce lasted long enough to fool people. After the March 2023 regional-bank panic, eleven large banks deposited $30 billion into First Republic to stabilize it, and the stock spent five weeks trading in a fairly calm $12-16 range — long enough that some investors treated it as a genuine survivor. Then the April 24 earnings call disclosed that customers had pulled more than half the bank's deposits anyway. The stock lost almost half its value the next trading day and was seized by the FDIC one week later, sold to JPMorgan for effectively nothing to existing shareholders.
WeWork's case has an extra twist worth knowing about: after the company actually filed Chapter 11 on November 6, its stock bounced again — more than doubling from $0.84 to $2.18 over the following week, purely on speculative meme-stock trading in a company that had already filed for bankruptcy. A dead cat bounce doesn't stop being possible just because the worst-case outcome already happened.
Why Dead Cat Bounces Happen
Three mechanical forces combine to produce them, and none of the three requires the underlying business to have actually improved:
- Short covering. Traders who profited from the stock's decline by short selling have to buy shares back to close their positions. After a stock drops sharply, some short sellers take profits, and that buying pressure alone can push the price up 20-100% in illiquid, heavily-shorted names — exactly the profile of most companies approaching bankruptcy.
- Bargain hunting on price alone. A stock that fell from $30 to $2 "looks cheap" to someone anchoring on the old price, without asking whether the business is still solvent. This buying is based on how far the stock has already fallen, not on any assessment of what it's actually worth now.
- Oversold technical signals. Momentum indicators like RSI can flag a stock as "oversold" after a sharp decline, which triggers systematic and momentum-following buyers regardless of the fundamental story. The technical signal fires the same way whether the company is a temporarily unloved value stock or a company that's genuinely going to zero.
None of these three forces requires anyone to believe the company's actual situation has changed — which is exactly why the bounce fails as soon as the next piece of real information (an earnings call, a bankruptcy filing, a missed debt payment) arrives.
Four Ways to Tell a Dead Cat Bounce From a Real Reversal
- Volume on the way up vs. volume on the way back down. A real reversal tends to show volume building as the stock climbs. A dead cat bounce often shows fading volume into the highs — the buying pressure runs out — and then a volume increase on the resumed decline, as the same short-term buyers dump their positions.
- Does it reclaim and hold the 50-day moving average? A bounce that pokes above the 50-day and immediately fails back below it is behaving very differently from one that reclaims the average and consolidates above it for multiple weeks. See Golden Cross vs Death Cross: Complete Guide to Moving Average Crossovers for how moving average relationships define trend, not just single price points.
- How much of the prior decline does it retrace? As a rough rule of thumb, bounces that retrace less than 50% of the preceding drop are more likely to be corrective moves inside a continuing downtrend, while reversals that retrace more than 50% and hold are more consistent with an actual change in direction. None of the four bounces above retraced anywhere close to the full prior decline in any of these stocks — all four names had already fallen 80%+ from their highs before the "bounce" even started.
- Does it survive the next scheduled catalyst? Every one of these four bounces was still standing right up until a specific, datable event: an earnings call, a bankruptcy court filing, an FDIC seizure. A real reversal generally survives the next earnings report; a dead cat bounce is frequently ended by it.
This is also why bull traps and dead cat bounces get confused — both are false upside signals that reverse — but a bull trap is usually a shorter-term breakout failure at a specific resistance level, while a dead cat bounce is a broader phenomenon inside a company already in serious fundamental decline.
The Trading Mistake This Sets Up
The dangerous version of a dead cat bounce isn't "the stock went up and then down" — it's the psychological trap it sets: a trader who bought the initial drop is suddenly showing a gain during the bounce, decides the worst is over, and holds through the resumed decline instead of cutting the loss. In three of the four cases above, the stock lost more than 85% of its value in the weeks immediately following the bounce.
The more reliable approach isn't trying to predict in advance whether a given bounce is real — nobody can do that consistently. It's having a plan for what happens if it isn't:
- A trailing stop below the bounce's low locks in the fact that if the stock breaks back below where the bounce started, the thesis that it found a floor is wrong. See Trailing Stop Loss Explained.
- A price alert at the pre-bounce low tells you the moment a "recovery" gives back its entire gain, rather than requiring you to watch the chart during the exact session it happens.
- A volume alert on the way down flags when selling volume picks back up after a quiet bounce — often the first real sign the bounce is ending. See Volume Spike Alerts: How to Catch Institutional Moves Before Price Follows.
None of this requires correctly guessing whether the recovery is real. It just means the trade has a defined exit if it isn't — which, in stocks heading toward a real bankruptcy, it usually isn't.
Related Reading
- Golden Cross vs Death Cross: Complete Guide to Moving Average Crossovers
- Bull Traps and Bear Traps: Avoid False Breakouts
- Short Squeeze Explained: How Forced Buying Creates Explosive Stock Rallies
- Trailing Stop Loss Explained: How to Lock In Gains Without Capping Your Upside
- Volume Spike Alerts: How to Catch Institutional Moves Before Price Follows
- How to Set Stock Price Alerts: Complete Setup Guide for Traders
Stock Alarm on your phone
Set price alerts and follow the stocks you track in the Stock Alarm app for iPhone and Android.
Want alerts like these? Get started free.
Join 295,000+ traders using Stock Alarm to stay ahead of the market.
See it work — free
Track markets, screen stocks, and set price alerts with Stock Alarm Pro. Explore the live markets free — no account needed. Trusted by 295,000+ investors.
S&P 500 Screener
Filter by metrics, fundamentals
Price Alerts
Never miss a move
35+ Global Markets
Stocks, crypto, futures
AI Analysis
Ask questions, get answers
Related Articles
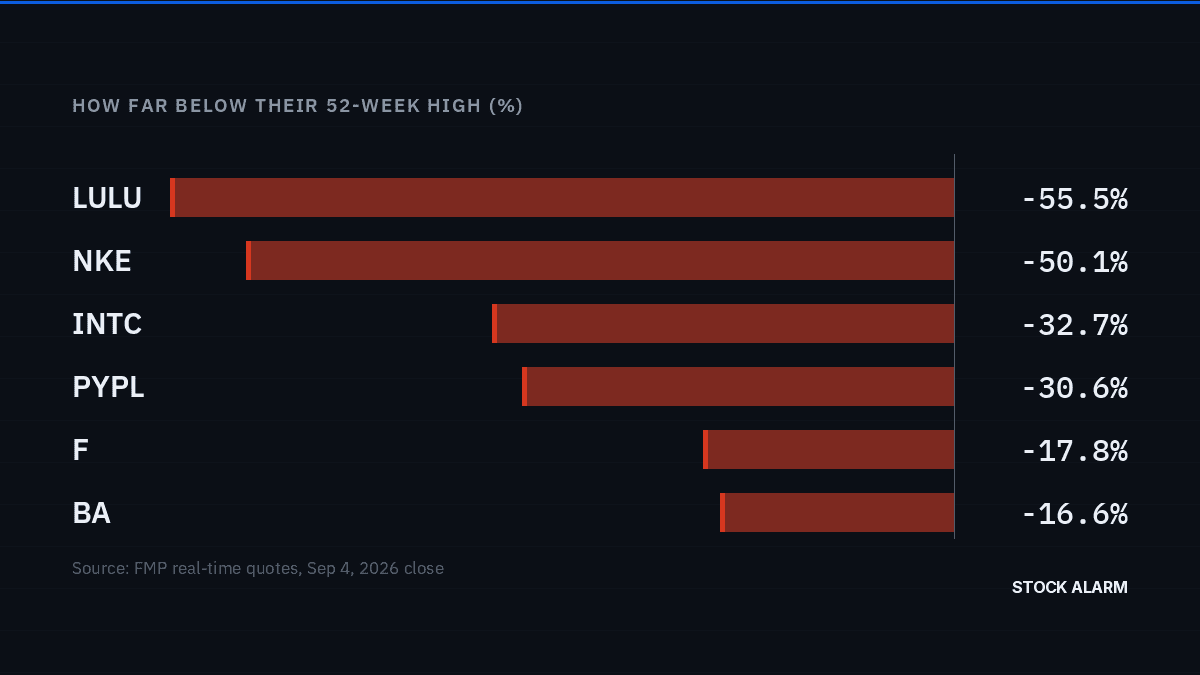
52-Week Low Explained: What It Means, Real Examples Right Now, and How to Avoid a Value Trap
A 52-week low isn't one signal, it's two. Lululemon just made a fresh one after a guidance cut; Intel made one in 2022, recovered, then made a lower one in 2025 before a 428% run. Here's how to tell them apart.
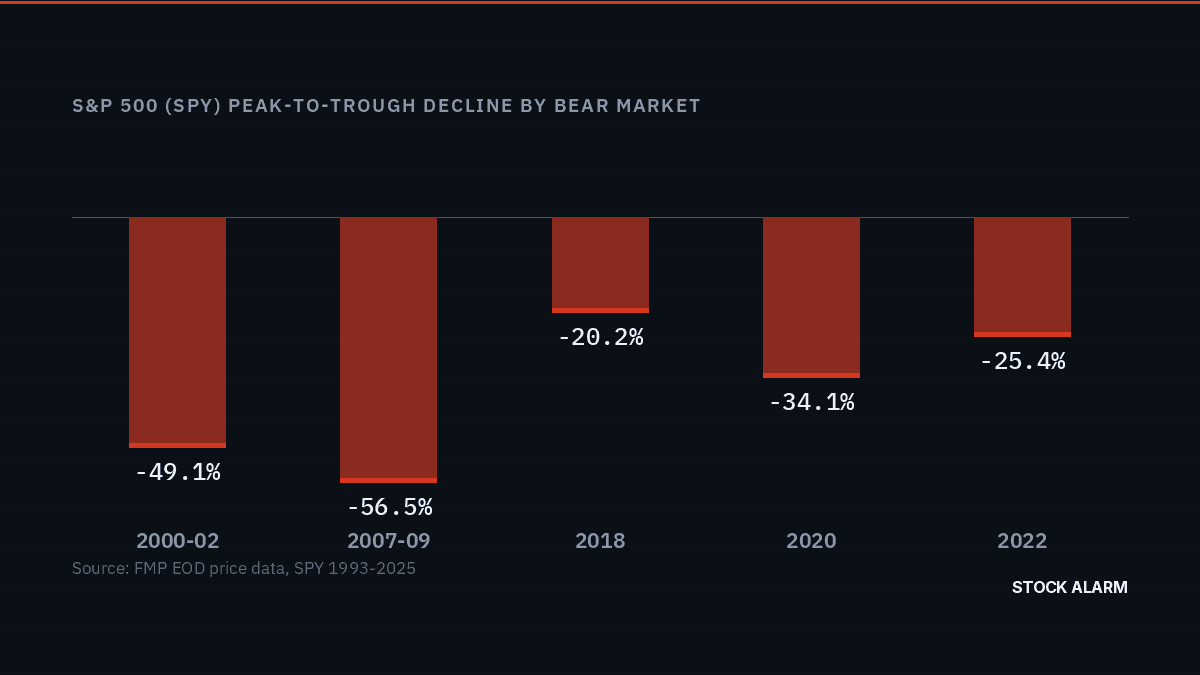
What Is a Bear Market? Definition, Every S&P 500 Bear Since 1993, and How to Manage the Risk
A bear market is a 20%+ decline from a recent peak. Five real S&P 500 bear markets since 1993, computed from actual price data, show how differently they behave - and what actually helps once you're in one.
The Kelly Criterion: The Math Behind How Much to Bet on Any Trade
The Kelly Criterion is the formula professional gamblers and quant investors use to size every bet - here's how it works, a worked example, why full Kelly is too aggressive for real trading, and how to apply it to your own portfolio.