How to Backtest a Trading Strategy: Prove Your Edge Before Risking Real Money
Learn how to backtest a trading strategy step by step: write clear rules, avoid overfitting and look-ahead bias, judge sample size, and turn a tested idea into price alerts.
Every trading idea sounds convincing until you test it. Backtesting applies your rules to historical prices so you can see how the idea would have behaved before any money is at stake. Done well, it filters out weak ideas cheaply. Done badly, it gives false confidence, which is worse than no test at all.
What a Backtest Can and Cannot Tell You
A backtest answers: "If I had followed these exact rules in the past, what would have happened?" It does not prove the strategy will work next year. Markets change, and the past is only one sample. Treat a good backtest as permission to keep studying the idea, not as proof.
Step 1: Write Rules Precisely
If a rule needs judgment, it cannot be tested. Define each of these in plain, checkable terms:
- Universe: which stocks (for example, S&P 500 members above a minimum volume)
- Entry: the exact trigger (for example, close above the 50-day moving average)
- Exit: profit target, stop-loss, or time limit
- Position size: a fixed dollar amount or a fixed percent of the account
- Costs: commissions, spreads and slippage
Step 2: Get Honest Data
Use data that reflects what was knowable at the time. Two traps appear here:
- Survivorship bias: testing only companies that exist today ignores those that were delisted or went bankrupt, which makes results look better than reality.
- Look-ahead bias: using information that was not yet public, such as a restated financial figure or a signal calculated from a day's close but traded at that day's open.
Step 3: Check the Sample Size
A handful of winning trades proves very little. The table shows how wide the uncertainty is on a measured win rate when the true rate is 50% (95% confidence, standard binomial math):
| Number of trades | Margin of error on win rate |
|---|---|
| 30 | about ±17.9 points |
| 100 | about ±9.8 points |
| 400 | about ±4.9 points |
| 1,000 | about ±3.1 points |
A 60% win rate over 30 trades is well within the noise of a coin flip. Aim for at least a few hundred trades across different market conditions before trusting a result.
Step 4: Look Beyond Total Return
Judge a strategy on more than profit:
- Maximum drawdown: the worst peak-to-trough fall. Could you hold through it? See our guide to max drawdown.
- Risk-adjusted return: compare return to volatility, for example with the Sharpe ratio.
- Win rate and average win versus average loss: a 40% win rate can still be profitable if winners are much larger than losers.
- Consistency: results by year, not one great year hiding several poor ones.
Step 5: Avoid Overfitting
Adjusting a moving average from 50 to 47 to 46 days until the curve looks perfect is curve fitting. The more parameters you tune, the more you capture noise. Defenses:
- Keep rules simple, with few adjustable numbers
- Test on out-of-sample data: build the rules on one period, then check them on a period you never touched
- Prefer settings where nearby values also work, rather than one lucky spike
- Be suspicious of results that look too good
Step 6: Paper Trade, Then Start Small
After the backtest, run the rules forward on new data without real money, or with a very small position. Live trading adds slippage, delays and emotion that no historical test fully captures. Compare live results with the backtest; a large gap means something in the test was off.
From Tested Rule to Live Monitoring
A strategy only works if you act on it consistently. This is where alerts help. With Stock Alarm Pro you can:
- Set price alerts at the exact entry, stop and target levels your rules define
- Use the screener to find stocks that currently meet your universe and entry filters
- Use portfolio alerts to be notified of important events on positions you hold
- Follow your plan without watching a screen all day
Key Takeaways
- Backtesting checks an idea against history; it never guarantees the future
- Write precise, testable rules including costs
- Avoid survivorship and look-ahead bias
- Small samples mislead: 30 trades carries roughly ±18 points of uncertainty on a win rate
- Keep rules simple, test out-of-sample, then paper trade before real money
- Use alerts to execute the plan consistently
This article is educational and not investment advice. The sample-size table uses standard statistical approximations for a true 50% win rate; actual strategy results vary and past performance does not guarantee future results.
Stock Alarm on your phone
Set price alerts and follow the stocks you track in the Stock Alarm app for iPhone and Android.
Want alerts like these? Get started free.
Join 295,000+ traders using Stock Alarm to stay ahead of the market.
See it work — free
Track markets, screen stocks, and set price alerts with Stock Alarm Pro. Explore the live markets free — no account needed. Trusted by 295,000+ investors.
S&P 500 Screener
Filter by metrics, fundamentals
Price Alerts
Never miss a move
35+ Global Markets
Stocks, crypto, futures
AI Analysis
Ask questions, get answers
Related Articles
When to Sell a Stock: 7 Exit Signals Traders Actually Use
Most traders obsess over entries and ignore exits. Here are the 7 specific signals professional traders use to know when to sell — and how to pre-set alerts so you never miss them.
Stock Market Correction Explained: What a 10% Drop Means and How Often It Happens
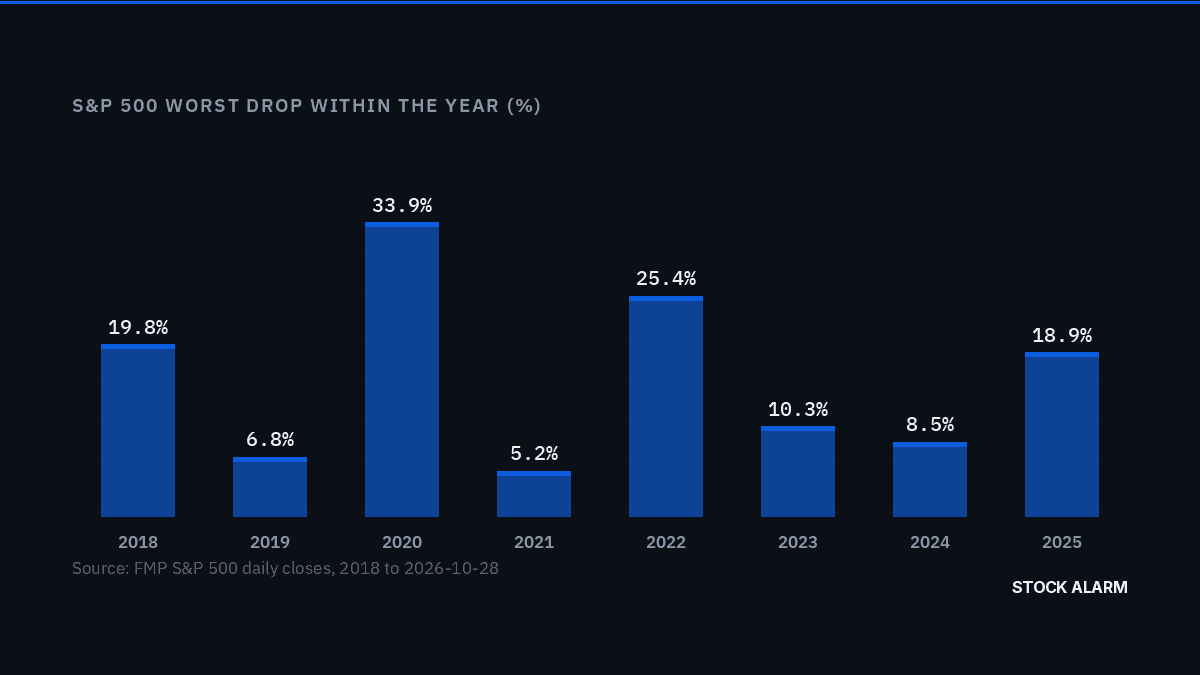
A stock market correction is a 10% to 20% decline from a recent high. See the largest S&P 500 declines in every year from 2018 to 2026, how often corrections happen, and how to prepare with price alerts.
Leveraged ETFs Explained: Why a 3x Fund Can Lose Money When the Index Goes Nowhere
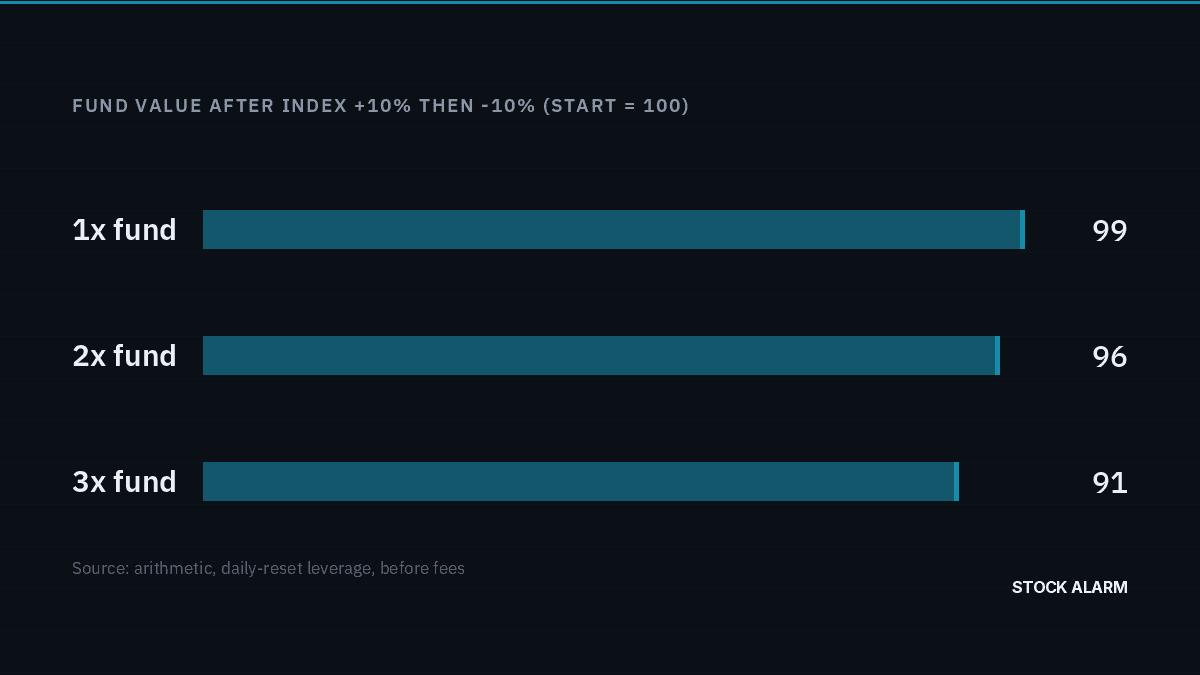
Leveraged ETFs reset their exposure every day, so volatility quietly erodes returns. See the exact math behind volatility decay, why holding a 2x or 3x fund for months can surprise you, and how to set alerts to manage the risk.