Electrum Special Acquisition Corp (ELEC)
P/E Ratio
1123.23×
Current · As of:
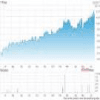
ELEC P/E Ratio
Latest1123.23×as of
Latest1123.23×as of
ELEC P/E Ratio (Daily) (998.70× → 1123.23×)
Latest values, visible window
High-resolution chart · PNG
ELEC p/e ratio history
Daily history. Dates identify market observations.
| Date | P/E Ratio |
|---|---|
| 1,123.23× | |
| 1,120.99× | |
| 1,119.87× | |
| 1,114.27× | |
| 1,123.23× | |
| 1,118.75× | |
| 1,118.76× | |
| 1,114.27× | |
| 1,115× | |
| 1,116.5× | |
| 1,119.87× | |
| 1,122.11× | |
| 1,120.99× | |
| 1,008.79× | |
| 1,006.75× | |
| 1,003.74× | |
| 1,003.74× | |
| 1,001.81× | |
| 999.7× | |
| 998.71× | |
| 1,000.72× | |
| 998.7× | |
| 998.7× | |
| 1,000.72× | |
| 1,000.72× | |
| 998.7× |