On-Balance Volume (OBV): How to Read Volume Flow and Spot Breakouts Early
Learn how the on-balance volume (OBV) indicator is calculated, how to read OBV divergences and breakouts, where it fails, and how to set alerts so you catch volume-confirmed moves.
Price tells you where a stock closed. Volume tells you how many shares were willing to trade there. On-balance volume (OBV) combines the two into a single line, so you can see at a glance whether volume is backing a move or quietly leaking away from it.
This guide covers how OBV is calculated, how to read it, the setups traders use, where it breaks down, and how to pair it with alerts.
What Is On-Balance Volume?
OBV was introduced by market analyst Joseph Granville in the 1960s. The idea is simple: volume precedes price. If a stock is steadily being accumulated, volume on up days should outweigh volume on down days, and the OBV line will rise before the price necessarily does.
OBV is a cumulative indicator. It never resets; it just keeps adding or subtracting each day's volume.
How OBV Is Calculated
There are three rules, applied each day:
| Today's close vs. yesterday's | OBV today |
|---|---|
| Higher | Yesterday's OBV + today's volume |
| Lower | Yesterday's OBV - today's volume |
| Unchanged | Same as yesterday |
A Hypothetical Example
These numbers are made up to show the arithmetic, not real market data.
| Day | Close vs. prior | Volume | OBV |
|---|---|---|---|
| 1 | (start) | 1,000,000 | 0 |
| 2 | Up | 1,500,000 | +1,500,000 |
| 3 | Up | 800,000 | +2,300,000 |
| 4 | Down | 2,000,000 | +300,000 |
| 5 | Up | 1,200,000 | +1,500,000 |
Notice that day 4 was a single heavy down day that wiped out most of the gains from two up days. OBV treats the size of the volume as the vote, not just the direction of the close.
One caveat: OBV assigns the entire day's volume to the up or down side based only on the close. A stock that rises 0.01% on huge volume gets the same treatment as one that surges 5%. That is a built-in simplification, and it matters later.
Why the Absolute Number Does Not Matter
The starting value is arbitrary. An OBV of 50 million on one chart and 2 million on another says nothing about which stock is stronger. What you read is:
- Direction: rising, falling or flat
- Slope: steep or gradual
- Relationship to price: confirming or diverging
Many charting platforms add a moving average to the OBV line to make direction easier to judge.
Three Ways to Read OBV
1. Trend confirmation
In a healthy uptrend, price makes higher highs and OBV makes higher highs. Volume is supporting the move. In a healthy downtrend, both make lower lows. If price and OBV agree, the trend has more credibility.
2. Divergence
This is the most popular use of OBV, and it works like RSI divergence:
- Bearish divergence: price makes a new high, but OBV makes a lower high. Fewer shares are behind each push higher.
- Bullish divergence: price makes a new low, but OBV makes a higher low. Sellers are running out of steam.
Divergence says the trend is weakening, not that it has ended. Stocks can diverge for weeks before anything happens, so treat it as a reason to tighten risk, not as a sell signal by itself.
3. OBV breakouts
Sometimes OBV breaks above its own resistance before price does. Picture a stock stuck in a range while the OBV line climbs to a new high. That pattern suggests accumulation, and traders watch for the price to follow. The reverse, OBV breaking support while price holds, hints at distribution. For the bigger picture on this idea, see our guide to Wyckoff volume analysis.
A Simple OBV Checklist for a Breakout
Before trusting a price breakout, check:
- Did price clear a clear level? Use support and resistance you identified in advance.
- Was breakout-day volume well above average? See what trading volume tells you.
- Is OBV at or near a new high? If OBV is lagging, the move is less convincing.
- Is there a stop level? Decide where the setup is wrong before you enter.
A breakout that passes all four is stronger than one that passes only the first.
Where OBV Falls Short
- Lagging in choppy markets. In a sideways range, OBV zigzags and gives false divergences.
- All-or-nothing volume. A one-cent gain counts the same as a big rally. Indicators like the Accumulation/Distribution line weight volume by where the close sits in the day's range; OBV does not.
- Gaps and one-off events. Index rebalancing days, options expirations and earnings produce enormous volume that can permanently shift the line without reflecting real accumulation.
- Thinly traded stocks. A few large trades can swing OBV a lot, so the signal is noisy on low-volume names.
- Not a timing tool. OBV can stay divergent for a long time. Pair it with price structure, VWAP or momentum indicators before acting.
Like every indicator, OBV describes the past. It does not predict the future, and it should be one input among several.
Using Alerts With OBV
OBV is rarely available as a direct alert condition, but you can build a workflow around the things it depends on: price and volume.
- Set a price alert at the breakout level. When price reaches it, you are notified instead of watching the chart. Start with how to set stock price alerts.
- Add a volume alert. Unusual volume is the raw input that moves OBV. Our volume spike alerts guide explains how to catch it.
- Check OBV when either alert fires. Open the chart, see whether OBV confirms the move, and decide using your plan.
- Set a downside alert at your stop. The same discipline applies on the way down.
This keeps screen time low while still giving OBV a role in the decision.
Key Takeaways
- OBV is a cumulative total: add volume on up closes, subtract it on down closes
- Only the direction and slope of the line matter, never the absolute number
- Use it to confirm trends, spot price/OBV divergences, and cross-check breakouts
- It can lag, misread one-off volume events, and generate false signals in ranges
- Combine it with price levels and other indicators, not on its own
- Alerts on price and volume tell you when to open the chart and check OBV
This article is educational and not investment advice. Indicators do not predict future prices, and trading carries a risk of loss. The worked example uses hypothetical numbers.
Stock Alarm on your phone
Set price alerts and follow the stocks you track in the Stock Alarm app for iPhone and Android.
Want alerts like these? Get started free.
Join 295,000+ traders using Stock Alarm to stay ahead of the market.
See it work — free
Track markets, screen stocks, and set price alerts with Stock Alarm Pro. Explore the live markets free — no account needed. Trusted by 295,000+ investors.
S&P 500 Screener
Filter by metrics, fundamentals
Price Alerts
Never miss a move
35+ Global Markets
Stocks, crypto, futures
AI Analysis
Ask questions, get answers
Related Articles
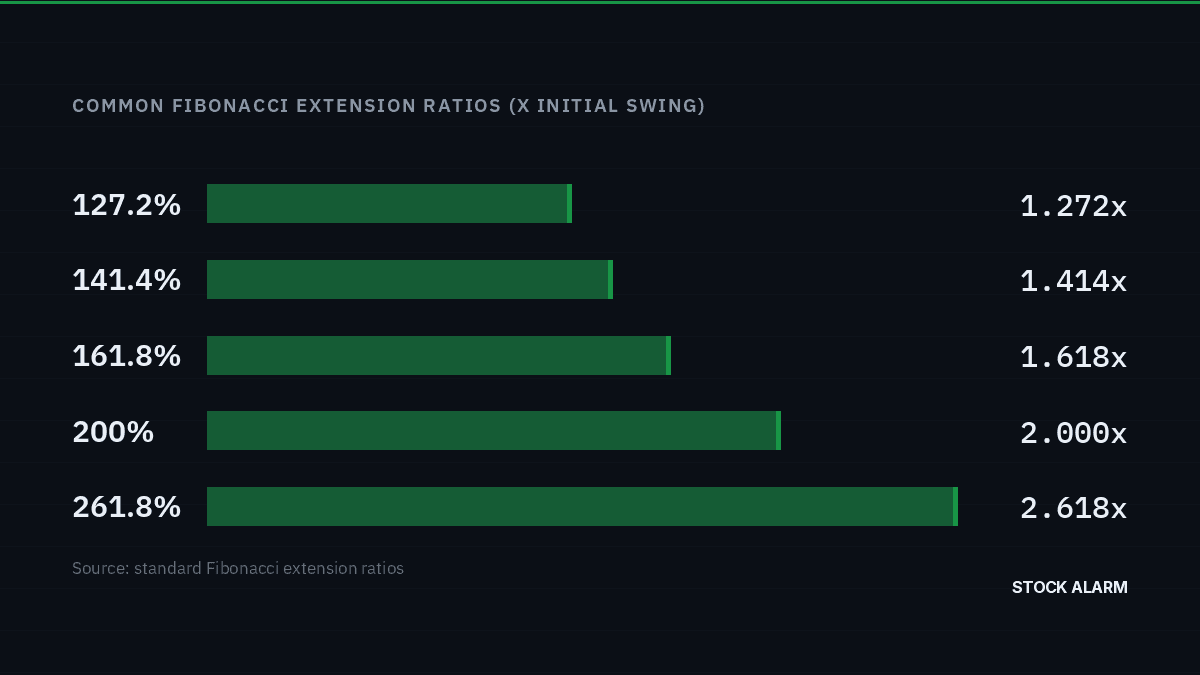
Fibonacci Extension Levels: How to Set Profit Targets Beyond the Breakout
Learn how Fibonacci extension levels (127.2%, 161.8%, 261.8%) project price targets, how to draw the three-point setup, where extensions fail, and how to set price alerts at each target.
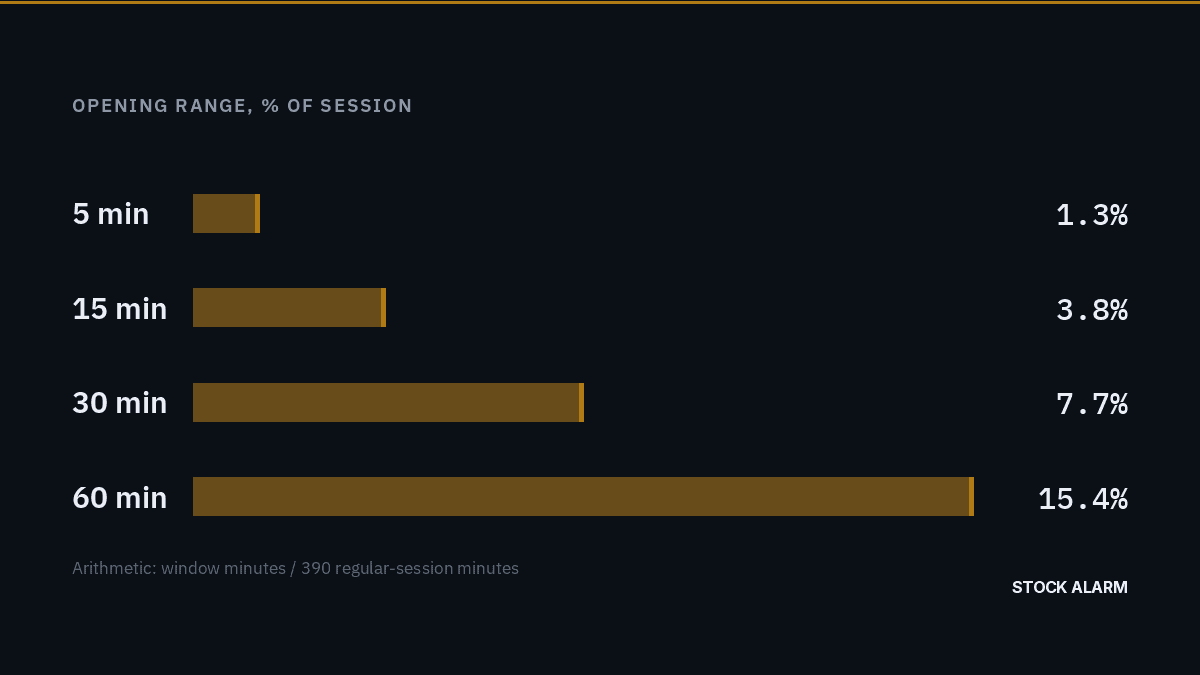
Opening Range Breakout: How the First 30 Minutes Can Set Up Your Trade
Learn the opening range breakout (ORB) strategy: how to mark the first 5, 15 or 30 minutes, define entries, stops and targets, avoid false breakouts, and set price alerts at the range.
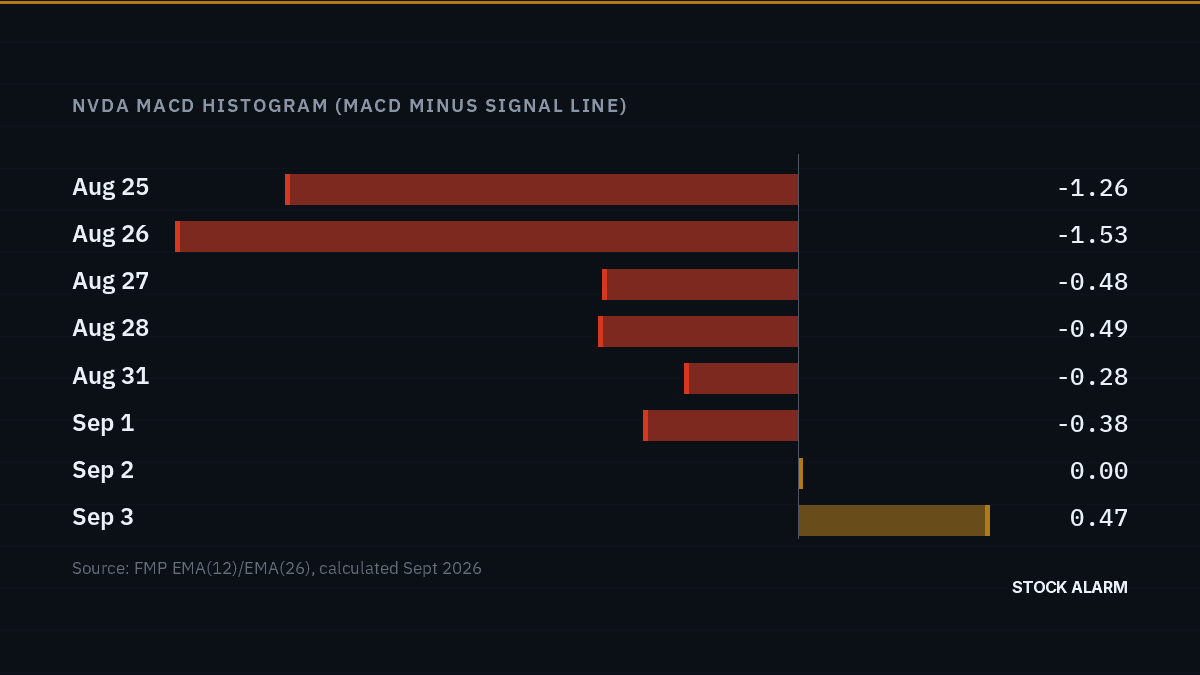
MACD Indicator Explained: How to Read Crossovers, Histograms, and Divergence
MACD is built from two moving averages, but it behaves like a momentum gauge, not a trend line. The construction, the three real signals it gives, why it lags, and a real recent crossover on NVDA showing what the indicator actually looked like as the move happened.