Opening Range Breakout: How the First 30 Minutes Can Set Up Your Trade
Learn the opening range breakout (ORB) strategy: how to mark the first 5, 15 or 30 minutes, define entries, stops and targets, avoid false breakouts, and set price alerts at the range.
The first minutes after the market opens are the busiest of the day. Overnight news, earnings, pre-market orders and fresh institutional flow all hit at once. The opening range breakout (ORB) strategy turns that chaos into a simple, rule-based setup: mark the high and low of the opening range, then act only if price breaks out of it.
This guide explains how the strategy works, how to define each piece, where it fails, and how to use alerts so you do not have to stare at a chart.
What Is the Opening Range?
The opening range is the high-to-low price range of a stock during the first N minutes of the regular session, which starts at 9:30 a.m. Eastern. Traders typically use 5, 15 or 30 minutes.
| Window | Range ends (ET) | Share of the 390-minute session |
|---|---|---|
| 5 minutes | 9:35 a.m. | 1.3% |
| 15 minutes | 9:45 a.m. | 3.8% |
| 30 minutes | 10:00 a.m. | 7.7% |
| 60 minutes | 10:30 a.m. | 15.4% |
The idea is that the opening range captures the first real tug-of-war between buyers and sellers. A decisive move out of it can signal which side has control for the next stretch of the session.
The Basic Rules
A simple ORB plan has five parts. Write them down before the open, not during it.
- Choose the stock. Favor liquid names with a reason to move today: earnings, news, or unusually high pre-market volume.
- Mark the range. Note the high and low of your chosen window once it closes.
- Define the entry. Long above the range high, or short below the range low. Some traders wait for a candle to close beyond the level rather than a mere touch.
- Define the stop. Often the other side of the range, or its midpoint for a tighter risk.
- Define the target. A common approach is a multiple of the range height, such as 1x or 2x the distance from range high to range low, or a prior resistance level.
If the plan does not state entry, stop and target in numbers, it is not yet a strategy.
A Worked Example With Made-Up Numbers
Suppose a stock opens at $50.00 and in its first 15 minutes trades between $49.60 and $50.40. The range is $0.80 wide.
- Long trigger: above $50.40
- Stop: $49.60 (the range low), a risk of about $0.80 per share
- Target at 1x range: $51.20, a reward of about $0.80 per share, or 1:1
- Target at 2x range: $52.00, a reward of $1.60 per share, or 2:1
The numbers are illustrative only. The point is that the range width sets both your risk and your target distance, which makes position sizing straightforward. If you risk $100 and your stop is $0.80 away, you size around 125 shares, before commissions and slippage. See our position sizing guide for the method.
Why Breakouts Fail
The ORB looks clean on a chart that has already played out. In real time, many breakouts fail. Common reasons:
- Low volume. A break above the range on thin volume often reverses. Many traders look for volume well above normal at the breakout.
- Narrow, choppy ranges. When the range is tiny, normal noise can poke through both sides in the same morning.
- Gaps. If a stock gaps up a long way, the range may already sit near an exhaustion point. Read our gap up and gap down guide for context.
- Scheduled news. Economic releases and Fed events can whipsaw price right after your entry.
- Market direction. A long breakout against a sharply falling index has lower odds than one that agrees with it.
Treat every filter you add as a hypothesis to test, not a rule that guarantees profit.
Choosing the Window
Shorter windows give earlier entries and tighter stops, but more false signals. Longer windows give fewer, later signals with wider stops, which means smaller position sizes for the same dollar risk. Because the trade-off is real, the only honest answer is to test. Our guide on how to backtest a trading strategy covers sample size and overfitting, both of which matter a lot for intraday setups with limited history.
Risk Management Rules
- Risk a small, fixed fraction of your account per trade
- Use the stop every time; do not move it further away
- Account for spread and slippage, which are a larger share of the profit on small intraday moves. See bid-ask spread explained
- Set a daily loss limit so a bad morning does not become a bad week
- Remember pattern day trader rules if you trade a margin account under the regulatory equity minimum
From Plan to Alerts
Once the range closes, the work becomes waiting. This is where alerts replace screen time. With Stock Alarm Pro you can:
- Set a price alert just above the range high and just below the range low so you are notified when a breakout starts
- Add an alert at your stop level and target level to track the trade
- Use the screener before the open to build a short list of liquid, active stocks to watch
- Receive alerts on your phone so you can step away between setups
Read our day trading alerts setup guide for a full walk-through of intraday alert design.
Key Takeaways
- The opening range is the high and low of the first 5, 15 or 30 minutes after the 9:30 a.m. ET open
- A breakout strategy needs written entry, stop and target rules
- Range width sets both risk and target distance, which simplifies sizing
- Many breakouts fail, especially on low volume or in choppy conditions
- Test your window and filters before risking real money
- Price alerts at the range edges let you act without watching every tick
This article is educational and not investment advice. Examples use made-up numbers for illustration. Day trading carries substantial risk of loss and past performance does not guarantee future results.
Stock Alarm on your phone
Set price alerts and follow the stocks you track in the Stock Alarm app for iPhone and Android.
Want alerts like these? Get started free.
Join 295,000+ traders using Stock Alarm to stay ahead of the market.
See it work — free
Track markets, screen stocks, and set price alerts with Stock Alarm Pro. Explore the live markets free — no account needed. Trusted by 295,000+ investors.
S&P 500 Screener
Filter by metrics, fundamentals
Price Alerts
Never miss a move
35+ Global Markets
Stocks, crypto, futures
AI Analysis
Ask questions, get answers
Related Articles
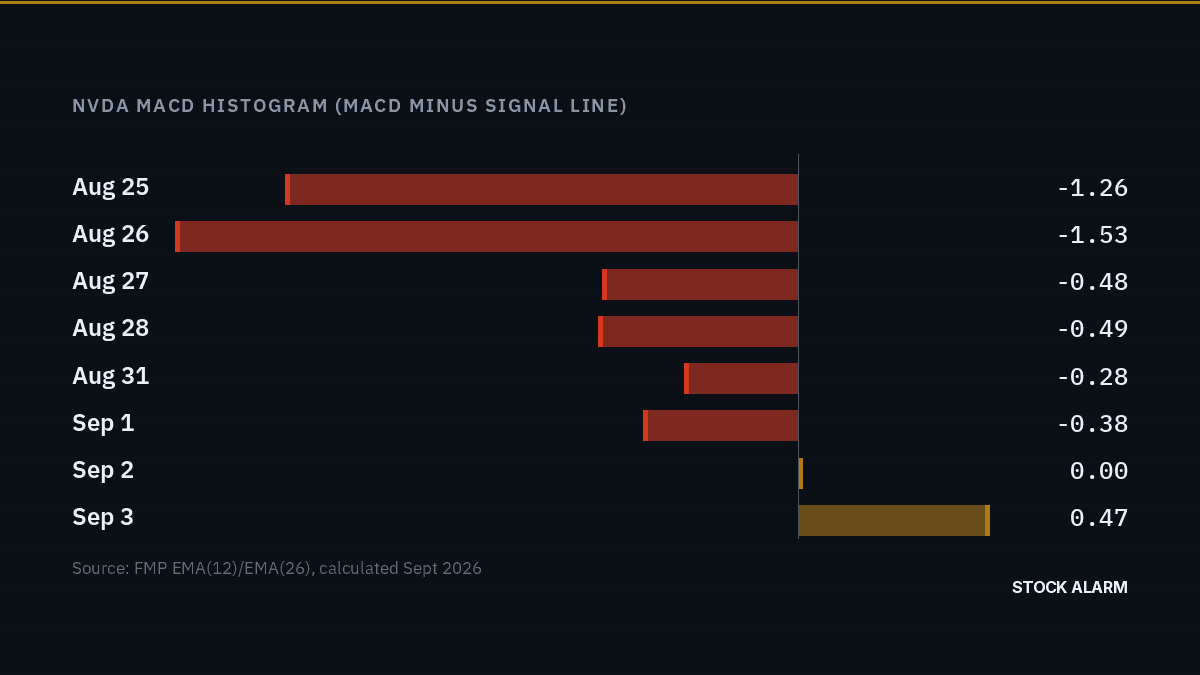
MACD Indicator Explained: How to Read Crossovers, Histograms, and Divergence
MACD is built from two moving averages, but it behaves like a momentum gauge, not a trend line. The construction, the three real signals it gives, why it lags, and a real recent crossover on NVDA showing what the indicator actually looked like as the move happened.
Day Trading vs. Swing Trading: Which One Fits You?
Compare day trading and swing trading: time commitment, capital rules, win rates, taxes, and which style actually fits a full-time job.
Bollinger Bands Trading Guide: Squeeze, Breakout, and Alert Strategies
Learn how to trade the Bollinger Band squeeze, walk the bands in trends, spot W-bottom and M-top reversals, and set alerts to catch volatility expansions the moment they happen.