Santa Claus Rally Explained: What the Data Says About the Year-End Stock Market Bounce
The Santa Claus rally is the S&P 500's tendency to rise in the last five trading days of December and first two of January. See ten years of real SPY results, why it happens, and how to set alerts instead of trading a calendar.
Over the last ten year-end windows, the S&P 500 (via SPY) rose seven times and fell three. The average move was roughly +0.3%. That is the whole story of the Santa Claus rally: a real pattern, a small one, and much easier to talk about than to trade.
The Santa Claus rally is one of the best-known seasonal patterns in the stock market. It refers to the S&P 500's tendency to climb during the last five trading days of December and the first two trading days of January. Yale Hirsch gave it the name in the Stock Trader's Almanac, along with the famous rhyme: "If Santa Claus should fail to call, bears may come to Broadway."
Every year around Thanksgiving, financial media starts asking whether the rally will show up. Here is what the numbers actually look like.
Ten Years of Real Santa Claus Rally Results
We measured SPY's closing price from the close before the five-day window began to the close of the second trading day of January. That means the window is seven trading days long.
| Season | Start (close) | End (close) | SPY change |
|---|---|---|---|
| 2015-16 | $206.02 | $201.36 | -2.26% |
| 2016-17 | $225.38 | $226.58 | +0.53% |
| 2017-18 | $267.58 | $270.47 | +1.08% |
| 2018-19 | $240.70 | $244.21 | +1.46% |
| 2019-20 | $321.22 | $322.41 | +0.37% |
| 2020-21 | $367.57 | $371.33 | +1.02% |
| 2021-22 | $470.60 | $477.55 | +1.48% |
| 2022-23 | $380.72 | $383.76 | +0.80% |
| 2023-24 | $472.70 | $468.79 | -0.83% |
| 2024-25 | $594.69 | $591.95 | -0.46% |
Source: FMP end-of-day closing prices for SPY. Prices are as reported, not adjusted for dividends.
A few takeaways:
- Seven of ten windows were positive. Three were negative, including the two most recent.
- The average was about +0.3% and the median about +0.7%. The 2015-16 loss pulls the average down.
- The biggest gains clustered in 2017 to 2022. The pattern was not uniform even inside this short sample.
- The sample is small. Ten observations cannot prove a pattern. Longer almanac studies report a stronger historical record, but the practical size of the move has always been modest.
Why Might a Year-End Rally Happen?
No single explanation is proven, but several come up repeatedly:
- Thin volume. Many institutional desks are closed. Fewer sellers can let modest buying lift prices. The trading volumes in the data above are visibly lower in the holiday sessions than in surrounding weeks.
- Tax-loss selling ends. Investors who sell losers for tax reasons tend to finish by late December. Once that pressure fades, prices can recover. See tax-loss harvesting for active traders.
- Holiday optimism and new-year cash. Year-end bonuses and fresh January contributions can add buying.
- Portfolio repositioning. Managers may buy winners for year-end reports or position early for the new year.
The same thin liquidity cuts both ways. Low volume can exaggerate a decline just as easily as a gain, which is how some of these windows ended negative.
Is the Santa Claus Rally a Reliable Signal?
Not reliably. Two cautions:
The edge is small. A +0.3% average over seven trading days is smaller than a typical single-day move in a volatile market. After commissions, spreads and taxes on short-term gains, a pure calendar trade has little room to profit.
A miss is not a forecast. The almanac saying suggests a weak window warns of trouble ahead. In this sample, the 2015-16 window was the worst and early 2016 did see a sharp selloff. But 2023-24 and 2024-25 were also negative windows, and they did not mark the start of a bear market. Context matters far more than a seven-day tally.
For how this fits alongside other calendar patterns, see our stock market seasonality guide and Sell in May strategy.
What to Do Instead of Trading the Calendar
Year-end is a useful moment for housekeeping, whatever the market does:
- Check your levels. Decide where you would add to or trim a position and set price alerts there, rather than watching quotes over the holidays. Here is how to set stock price alerts.
- Watch for holiday gaps. Early closes and closed days change when your orders can fill. Review the market holiday and trading hours guide.
- Protect gains with a plan. If your portfolio had a strong year, a trailing stop or a defined exit alert can keep a thin-volume drop from turning into a large one.
- Keep investing on schedule. If you use dollar-cost averaging, the calendar should not change the plan.
How to Track the Window With Stock Alarm
Stock Alarm lets you set price alerts on SPY, QQQ or any holding, so you hear about meaningful moves without sitting in front of a screen during the holidays. A reasonable setup:
- Set an alert on SPY a few percent above and below its current price.
- Add alerts on your largest positions at the levels where your plan changes.
- Review your list on the first trading day of January and reset levels for the new year.
Bottom Line
The Santa Claus rally is real in the sense that year-end windows have leaned positive, but the data shows a small average move, a meaningful number of misses, and no dependable forecasting power. Use it as a reminder to prepare, not as a reason to trade.
Related Reading
This article is educational and not investment advice. Past performance does not guarantee future results.
Stock Alarm on your phone
Set price alerts and follow the stocks you track in the Stock Alarm app for iPhone and Android.
Want alerts like these? Get started free.
Join 295,000+ traders using Stock Alarm to stay ahead of the market.
See it work — free
Track markets, screen stocks, and set price alerts with Stock Alarm Pro. Explore the live markets free — no account needed. Trusted by 295,000+ investors.
S&P 500 Screener
Filter by metrics, fundamentals
Price Alerts
Never miss a move
35+ Global Markets
Stocks, crypto, futures
AI Analysis
Ask questions, get answers
Related Articles
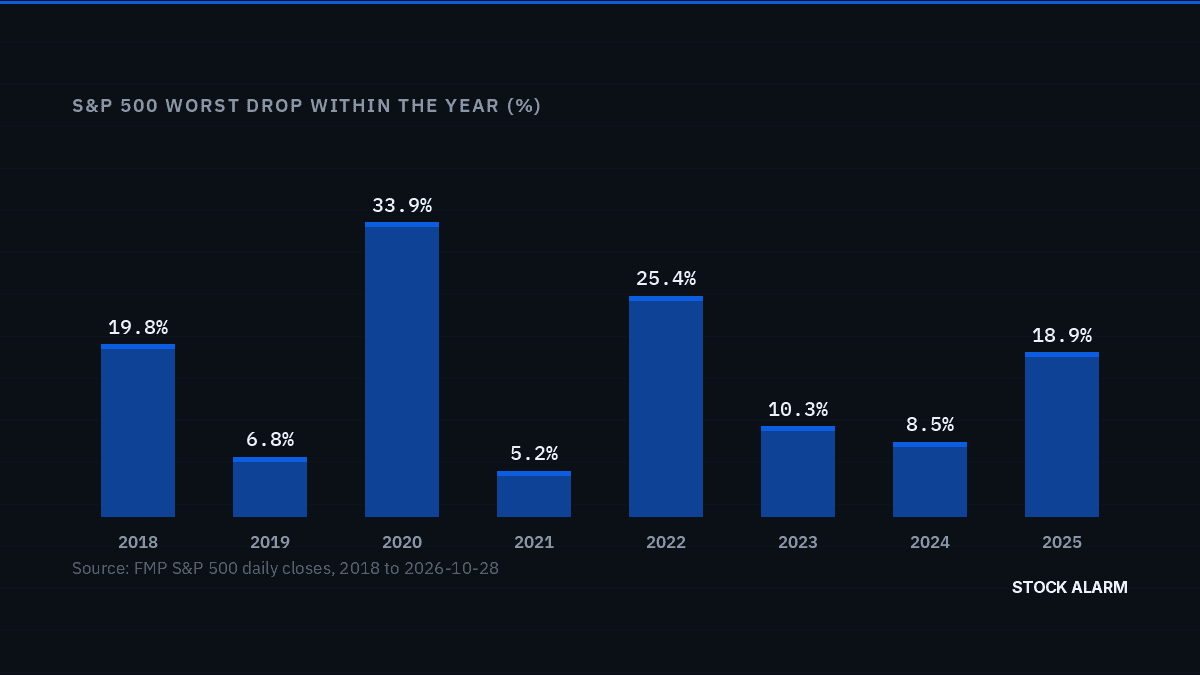
Stock Market Correction Explained: What a 10% Drop Means and How Often It Happens
A stock market correction is a 10% to 20% decline from a recent high. See the largest S&P 500 declines in every year from 2018 to 2026, how often corrections happen, and how to prepare with price alerts.
The Stock Market Just Hit All-Time Highs. Here's What the Numbers Say - and What to Do
The S&P 500 closed at its 24th record of 2026 and the Dow topped 54,000 for the first time. What actually happens at all-time highs, and how to trade around them without guessing.
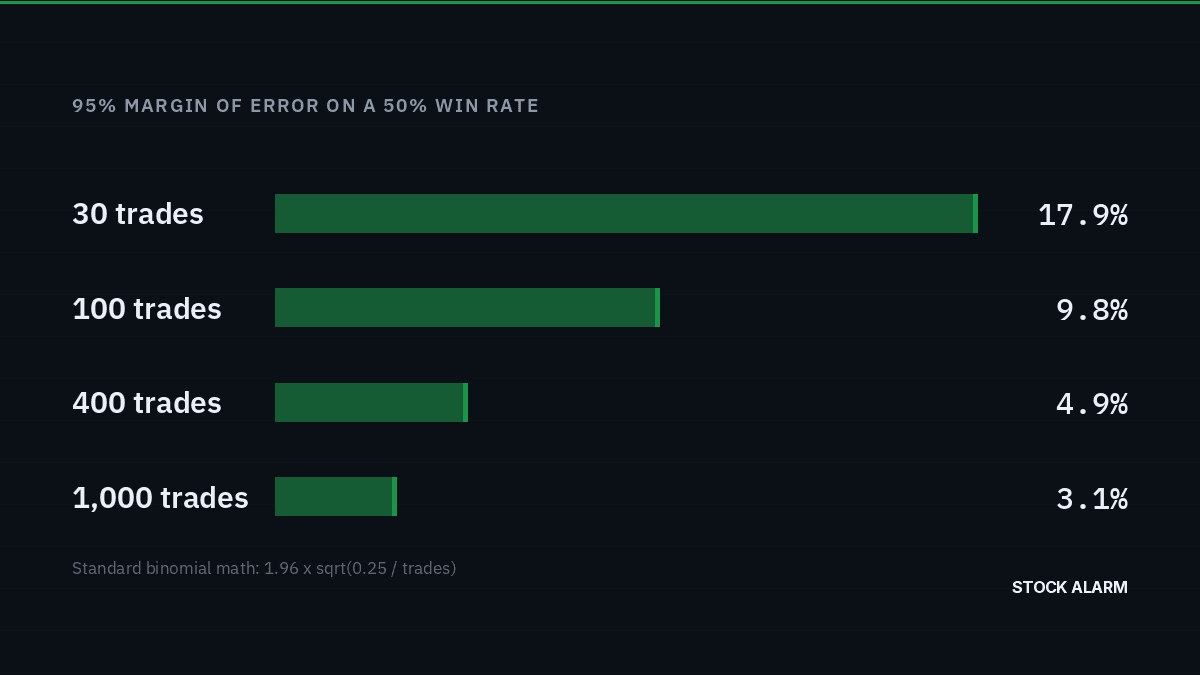
How to Backtest a Trading Strategy: Prove Your Edge Before Risking Real Money
Learn how to backtest a trading strategy step by step: write clear rules, avoid overfitting and look-ahead bias, judge sample size, and turn a tested idea into price alerts.