Fundamental Charts for Stock Analysis
Interactive charts for 120+ financial metrics — revenue, earnings, free cash flow, P/E ratio, gross margin, ROE, and more. Plot any metric over 10 years for any publicly traded stock, or compare metrics across multiple companies on one chart.
What Are Fundamental Charts?
Fundamental charts are visual representations of a company's financial data over time. Unlike price charts — which show only stock price and volume — fundamental charts plot the underlying business metrics that drive long-term value: revenue, earnings, cash flow, profitability margins, balance sheet strength, and valuation multiples.
A 10-year revenue chart immediately answers whether a business is growing, stagnating, or shrinking. A gross margin chart reveals whether a company is strengthening its competitive position or being squeezed by competition. A historical P/E ratio chart shows at a glance whether today's valuation is cheap or expensive relative to the stock's own history.
Fundamental charts are the core tool of value investors, growth investors, and quantitative analysts. They transform raw financial statement numbers — which are difficult to interpret in isolation — into clear visual trends that make analysis faster and more accurate.
10 Categories of Fundamental Charts
Every category of financial analysis covered in one tool. Click any metric to open its chart.
Growth
Measure how fast the business is expanding across revenue, earnings, and cash generation.
Valuation
Chart historical valuation multiples to spot when a stock is cheap or expensive relative to its own history.
Profitability
Track how much profit the company keeps from each dollar of revenue and how efficiently it uses capital.
Financial Health
Monitor the balance sheet strength and ability to cover obligations — critical for risk assessment.
Income Statement
Raw income statement figures plotted over time — the foundation of any fundamental analysis.
Cash Flow
Cash flow charts reveal the real economic engine of a business, separate from accounting earnings.
Balance Sheet
See how the asset base, debt load, and equity base have evolved over a decade.
Per Share
Per-share metrics adjust for dilution and share buybacks — essential for long-term return analysis.
Efficiency
Efficiency ratios measure how well management converts assets and capital into revenue.
Market Data
Plot market capitalization and price history alongside any financial metric for a complete picture.
The 6 Most Important Fundamental Charts
If you only chart six metrics for any stock, make it these. Together they give a complete picture of business quality, growth, and valuation.
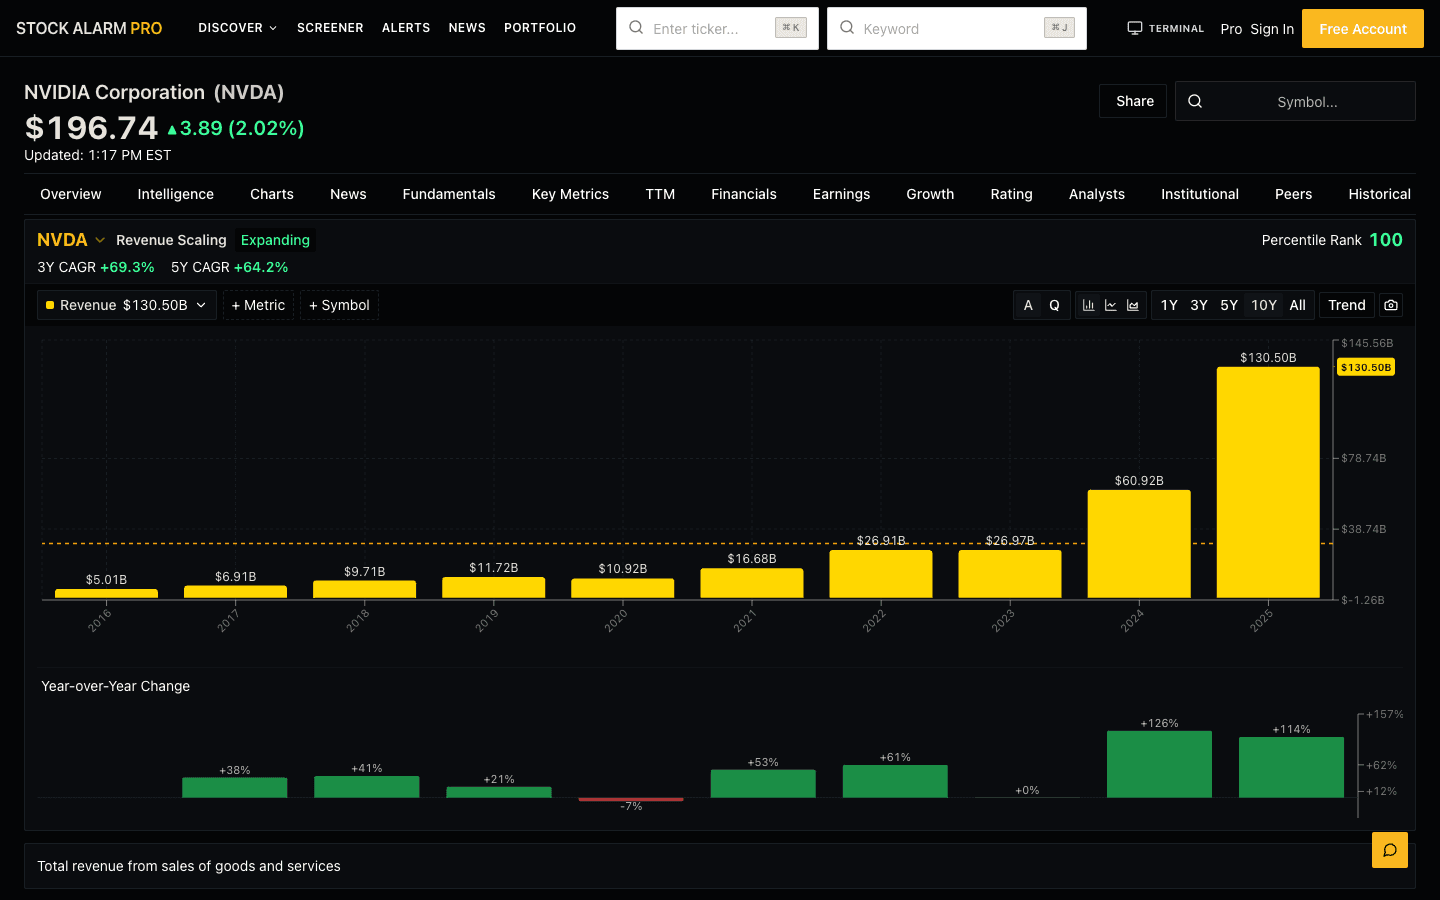
Revenue Chart
Revenue is the top line — the starting point of every income statement. A consistent upward revenue trend is the single clearest signal of a growing business. Flat or declining revenue almost always leads to earnings pressure.
Pro tip: Compare quarterly revenue growth YoY to strip out seasonality. Watch for accelerating or decelerating trends.
Free Cash Flow Chart
Free cash flow (FCF) is operating cash flow minus capital expenditures. It represents the actual cash a business generates that can be returned to shareholders or reinvested. Companies can manipulate earnings but not cash.
Pro tip: FCF margin (FCF as % of revenue) is more comparable across companies than raw FCF. Rising FCF margin = expanding economic moat.
P/E Ratio Chart
The price-to-earnings ratio chart shows how expensive the stock has been relative to its earnings at different points in time. Seeing that today's P/E is at a 5-year low vs. historical average is a powerful valuation signal.
Pro tip: Use the P/E chart alongside the PEG ratio chart. A high P/E with high growth (low PEG) is often reasonable — context is everything.
Gross Margin Chart
Gross margin measures pricing power and competitive moat. A software company with 70%+ gross margin has structural advantages that a retailer at 25% does not. Expanding gross margin over time signals growing competitive strength.
Pro tip: Gross margin compression is an early warning sign — it often precedes earnings misses. Chart gross margin alongside revenue to spot the 'squeeze' pattern early.
Return on Equity Chart
ROE measures how much profit a company generates for each dollar of shareholders equity. Consistently high ROE (20%+) over many years is the hallmark of a compounding business — the kind Buffett looks for.
Pro tip: Compare ROE to ROIC. If ROE is much higher than ROIC, the company may be using debt to boost returns. Both metrics together tell the full story.
EPS (Diluted) Chart
Diluted EPS accounts for all shares that could be outstanding (options, warrants, convertibles). An EPS chart over 5–10 years is the clearest representation of whether management is creating per-share value, especially when adjusted for buybacks.
Pro tip: EPS growth without revenue growth is a yellow flag — it may mean cost cuts or buybacks rather than business improvement. Always cross-reference with the revenue chart.
How to Read Fundamental Charts
1. Look for consistent direction, not short-term noise
Annual fundamental charts smooth out one-time charges, accounting adjustments, and seasonal swings. A company reporting 8 straight years of revenue growth is making a clear statement about business quality. One bad quarter stands out against a strong trend as an outlier — or an early warning.
2. Compare rate of change, not absolute levels
A company growing revenue from $100M to $500M over five years is far more interesting than one growing from $10B to $12B. When comparing companies, use growth rate charts (revenue growth %, EPS growth %) rather than absolute figures. The Chart Builder lets you plot multiple stocks indexed to 100 at a start date for apples-to-apples comparison.
3. Watch for margin expansion or compression
Gross margin, operating margin, and net margin charts are leading indicators. Expanding margins mean the company is gaining pricing power, cutting costs, or both — a sign of improving competitive position. Compressing margins often precede earnings misses by 1–2 quarters.
4. Use valuation charts vs. the company's own history
Valuation metrics like P/E, EV/EBITDA, and P/FCF are most meaningful when charted over time for the same company. A P/E of 25x might be cheap for a company that historically trades at 35x, or expensive for one that has never exceeded 20x. Context is everything.
5. Cross-reference cash flow against earnings
When net income is rising but free cash flow is flat or declining, that's a red flag. Companies can use aggressive accounting to inflate reported earnings, but they cannot fake cash. Always chart FCF alongside net income to verify earnings quality.
Build Any Fundamental Chart in Seconds
The Stock Alarm Pro Chart Builder lets you search any of 120+ financial metrics, pick any stock, and instantly render an interactive chart with up to 10 years of data. Compare any metric across multiple companies, adjust timeframes, and share your charts.
- 120+ metrics across 10 categories
- Multi-stock comparison on one chart
- Annual or quarterly data
- Custom date ranges
- Line, bar, and area chart types
- Indexed view for % comparison
Fundamental Charts by Stock
Jump directly to a company's complete fundamental overview — revenue, earnings, margins, cash flow, and valuation history in one page.
Fundamental Charts vs. Technical Charts
| Dimension | Fundamental Charts | Technical Charts |
|---|---|---|
| What they plot | Financial statement data (revenue, earnings, cash flow) | Price, volume, and derived indicators (RSI, MACD, MA) |
| Time horizon | Annual/quarterly — months to decades | Intraday to weekly — hours to months |
| Main question | Is this a good business growing over time? | Is price gaining or losing momentum right now? |
| Used by | Value investors, growth investors, analysts | Day traders, swing traders, momentum investors |
| Data source | SEC filings, income statement, balance sheet | Market price and volume data |
| Update frequency | Quarterly (earnings reports) | Real-time to daily |
Most professional investors use both. Read more: Technical vs. Fundamental Analysis — Which Should You Use?
How to Build a Fundamental Chart
Six steps from open browser to a complete multi-stock fundamental analysis chart.
- 1
Open the Chart Builder
Go to pro.stockalarm.io/charts. The chart builder opens with a default multi-stock price chart as a starting point.
- 2
Enter a stock ticker
Type any US-listed stock ticker into the search bar — AAPL, MSFT, NVDA, or any of 3,600+ stocks.
- 3
Select a fundamental metric
Switch the data source from "Price" to any fundamental category: Growth, Valuation, Profitability, Cash Flow, Balance Sheet, or Income Statement. Choose a specific metric like Revenue, EPS, or Gross Margin.
- 4
Set your timeframe
Select 1Y, 3Y, 5Y, or 10Y. Use 5Y minimum for a full business cycle view. Annual data shows the full picture; quarterly data shows acceleration or deceleration within a year.
- 5
Compare stocks (optional)
Click "Add Series" to overlay a second ticker with the same metric. Compare AAPL gross margin vs. MSFT gross margin on one chart to see who has the stronger business model.
- 6
Save or share your chart
Every chart gets a permanent share link. Save charts to your history for one-click access on your next session.
Fundamental Metric Alerts — Get Notified When the Numbers Change
Most fundamental charting tools stop at visualization. Stock Alarm Pro goes further: you can set price alerts triggered by fundamental data — so you never miss a key inflection point when it actually happens.
Earnings alerts
Get notified when a stock reports EPS above or below analyst estimates — immediately, not hours later.
Revenue milestone alerts
Set an alert when a company's quarterly revenue crosses a level you're watching. Useful for tracking high-growth turnarounds.
Valuation threshold alerts
Be the first to know when a stock's P/E ratio drops below a historical support level you've identified on the fundamental chart.
Price × fundamental alerts
Combine technical price levels with fundamental context — get alerted when a stock hits a price target and the fundamentals are improving.
Frequently Asked Questions
What are fundamental charts?
Fundamental charts are visual representations of a company's financial data over time — metrics like revenue, earnings per share (EPS), free cash flow, P/E ratio, gross margin, and return on equity (ROE). Unlike price charts that track stock price movements, fundamental charts show the underlying business performance: whether the company is growing, becoming more profitable, and how its valuation compares historically.
What financial metrics can I chart?
Stock Alarm Pro supports 120+ fundamental metrics across 10 categories: Growth (revenue growth, EPS growth, FCF growth), Valuation (P/E, P/B, EV/EBITDA, PEG), Profitability (ROE, ROIC, gross margin, operating margin, net margin), Financial Health (current ratio, debt-to-equity, interest coverage), Income Statement (revenue, EBITDA, net income), Balance Sheet (total assets, net debt, stockholders equity), Cash Flow (operating CF, free cash flow, CapEx), Per Share (EPS, revenue/share, book value/share), Efficiency (receivables turnover, inventory turnover, days sales outstanding), and Market Data (market cap, stock price, volume).
How much historical data do fundamental charts show?
Stock Alarm Pro fundamental charts show up to 10 years of annual data and up to 5 years of quarterly data for most financial metrics. Historical data is available for all major US-listed stocks.
What is the most important fundamental chart for stock analysis?
The five most important fundamental charts for stock analysis are: (1) Revenue growth — shows if the company is expanding its business; (2) Free cash flow — shows real economic profit after capital spending; (3) P/E ratio history — shows whether the stock is cheap or expensive relative to its own history; (4) Gross margin trend — shows pricing power and competitive moat; (5) Return on equity (ROE) — shows how efficiently management creates value. Together these charts give a complete picture of business quality, growth trajectory, and valuation.
Can I compare fundamental charts across multiple stocks?
Yes. The Stock Alarm Pro Chart Builder lets you plot any fundamental metric for multiple stocks on one chart. You can compare AAPL vs MSFT vs GOOGL revenue on a single chart, or benchmark any company's margins against peers — all with customizable date ranges and chart types (line, bar, area).
How is a fundamental chart different from a technical chart?
A technical chart plots price and volume over time to identify trading patterns and momentum. A fundamental chart plots financial statement data — revenue, earnings, cash flow, balance sheet metrics — to evaluate business quality. Fundamental charts answer "Is this a good business growing over time?" while technical charts answer "Is the stock gaining momentum right now?" Professional investors use both.