Pairs Trading Explained: How to Trade Two Related Stocks Against Each Other
Pairs trading bets on the gap between two related stocks, not the market's direction. Learn how pairs are chosen, how the spread is measured, a real KO vs PEP divergence, the risks, and how to watch it with alerts.
Most trades are a bet on direction: the stock goes up, or it goes down. Pairs trading is a bet on a relationship. You pick two stocks that usually travel together, and you trade the gap between them.
This guide explains how the idea works, walks through a real divergence between two famously linked stocks, covers what goes wrong, and shows how to monitor a pair with alerts.
What Is Pairs Trading?
A pairs trade has two legs:
- Long the stock that looks cheap relative to its partner
- Short the stock that looks expensive relative to its partner
If the gap closes, the trade can work whether the overall market rose, fell, or went nowhere. The market's push is meant to cancel out between the two legs, which is why the approach is often called market neutral. (If short selling is new to you, read our short selling guide first.)
The strategy dates back to quantitative trading desks in the 1980s. Today the same idea is used at every scale, from large funds to individual traders watching a single ratio.
The Core Idea: The Spread
The spread is simply how far apart the two stocks are. Traders measure it two common ways:
| Measure | Formula | Why use it |
|---|---|---|
| Price ratio | Price of A / Price of B | Easy to chart; shows relative strength |
| Price difference | Price of A - Price of B | Works when prices are similar in size |
The bet is mean reversion: when the spread stretches well beyond its usual range, it tends to drift back. A trader defines "usual" from history, often with an average and a standard deviation band, and acts when the spread moves far outside it.
A Real Example: Coca-Cola vs. PepsiCo
KO and PEP are textbook partners: two giant beverage and snack franchises with similar customers and similar sensitivity to consumer spending. Here is what actually happened to them over the past year, from closing prices:
| Nov 3, 2025 close | Nov 6, 2026 close | Change | |
|---|---|---|---|
| Coca-Cola (KO) | $67.97 | $95.67 | +40.8% |
| PepsiCo (PEP) | $143.60 | $141.34 | -1.6% |
| KO / PEP price ratio | 0.473 | 0.677 | +43.0% |
Two stocks that many investors treat as near-substitutes ended the year more than 42 percentage points apart. Over that stretch, PEP traded as high as $170.49 (Feb 6, 2026) while KO was in the high $70s, so the ratio did not move in a straight line.
What a pairs trader would ask
- Why did they diverge? If one company changed (new products, margins, a restructuring, a spin-off), the gap may be deserved. If nothing fundamental changed, the gap might be an opportunity.
- Is the ratio stretched against its own history? A ratio of 0.677 is far above where it sat a year ago. Whether that is "stretched" depends on how long a window you choose.
- Could the gap keep widening? Absolutely. That is the central risk, covered below.
This table is a snapshot of what happened, not a trade recommendation. A divergence that already ran 40+ points does not tell you which way the next move goes.
How to Build a Pairs Trade, Step by Step
- Start with a story, not a statistic. Look for two companies in the same industry with similar drivers: two payment networks, two home-improvement retailers, two big oil producers. Our sector rotation guide is a useful way to see which sectors to scan.
- Check the history. Chart the price ratio over one to three years. Do the two stocks tend to snap back after wide gaps, or does the ratio drift in one direction?
- Define the trigger in advance. For example: act only when the ratio is more than two standard deviations from its average. Write it down before you trade.
- Balance the legs. Size the long and short in similar dollar amounts so market moves roughly offset.
- Set an exit for both outcomes. One exit when the spread reverts, and one when it keeps widening and you are proven wrong. See our stop-loss risk management guide.
- Mind the costs. Borrow fees on the short leg, margin interest, and trading costs all eat into a trade that is aiming for a modest convergence.
Where Pairs Trading Goes Wrong
- The relationship breaks. The most dangerous failure. A merger, an accounting problem, or a business model shift can end the historical link for good. "It has to come back" is not a strategy.
- Correlation is not stable. Two stocks that moved together for three years can stop doing so after one earnings season.
- Short-side risk. A short position has no ceiling on losses, and a short squeeze can hit hard and fast.
- Hidden exposure. Two "similar" stocks may respond differently to rates, currencies, or commodity prices, so the pair is less neutral than it looks.
- Slow convergence. Even if the spread does revert, it can take longer than your borrow costs and patience allow.
- Crowding. Famous pairs are watched by many traders, and gaps can be quickly competed away or overshoot when everyone exits at once.
Using Alerts to Watch a Pair
You do not need to stare at two charts all day. A practical routine:
- Pick the pair and write down your reference levels for each stock: the price at which the gap would look stretched or would have closed.
- Set a price alert on each leg. When either stock reaches its level, you get notified and can check the ratio. See how to set stock price alerts.
- Add an earnings and news watch. Company-specific events are the most common reason pairs break. Our guide to market news alerts covers the setup.
- Set a stop alert on both sides. If the trade moves against you, you want the notification before the loss is large.
With Stock Alarm Pro you can set alerts on both stocks of a pair in the same place and keep them on your watchlist, so a move in either leg reaches you without constant monitoring.
Key Takeaways
- Pairs trading bets on the gap between two related stocks, not on market direction
- The core idea is mean reversion of a spread, measured as a ratio or a price difference
- KO and PEP moved +40.8% and -1.6% over the same year, a reminder that even close partners can drift far apart
- The biggest risk is that the relationship permanently breaks
- Short borrowing costs, sizing, and exits matter as much as the entry
- Price and news alerts on both legs let you monitor a pair without watching screens all day
This article is educational and not investment advice. Price data is from closing prices on the dates shown. Short selling and leveraged strategies carry a risk of substantial loss, and past relationships between stocks do not guarantee future behavior.
Stock Alarm on your phone
Set price alerts and follow the stocks you track in the Stock Alarm app for iPhone and Android.
Want alerts like these? Get started free.
Join 295,000+ traders using Stock Alarm to stay ahead of the market.
See it work — free
Track markets, screen stocks, and set price alerts with Stock Alarm Pro. Explore the live markets free — no account needed. Trusted by 295,000+ investors.
S&P 500 Screener
Filter by metrics, fundamentals
Price Alerts
Never miss a move
35+ Global Markets
Stocks, crypto, futures
AI Analysis
Ask questions, get answers
Related Articles
On-Balance Volume (OBV): How to Read Volume Flow and Spot Breakouts Early
Learn how the on-balance volume (OBV) indicator is calculated, how to read OBV divergences and breakouts, where it fails, and how to set alerts so you catch volume-confirmed moves.
Fibonacci Extension Levels: How to Set Profit Targets Beyond the Breakout
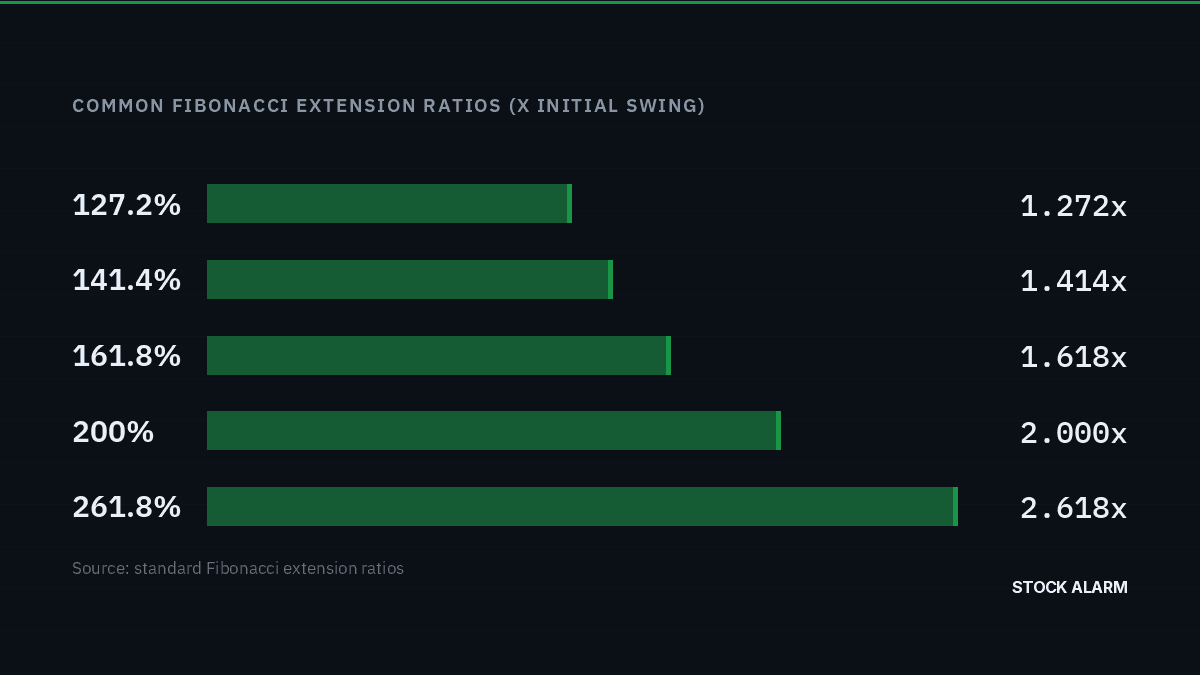
Learn how Fibonacci extension levels (127.2%, 161.8%, 261.8%) project price targets, how to draw the three-point setup, where extensions fail, and how to set price alerts at each target.
Opening Range Breakout: How the First 30 Minutes Can Set Up Your Trade
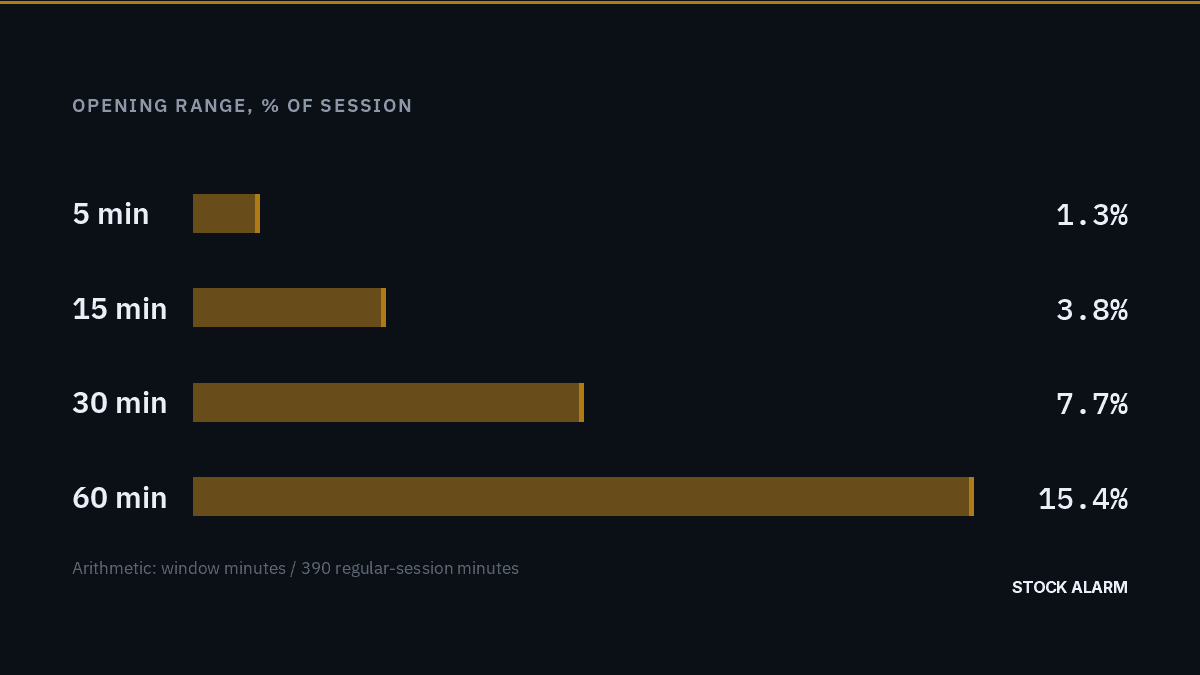
Learn the opening range breakout (ORB) strategy: how to mark the first 5, 15 or 30 minutes, define entries, stops and targets, avoid false breakouts, and set price alerts at the range.